
This guide aims to show you some of the most signigficant social media metrics.
You will find metrics regarding:
You can download and save the PDF version here.
(Just put 0€ on the price and it’s yours).
Reach: The number of people who saw your ads at least once.
Impression: The number of times your ads were on screen.
Frequency: The average number of times each person saw your ad.
Link Clicks: The number of clicks on links within the ad that led to advertiser-specified destinations, on or off Facebook.
Clicks: Any interaction with your content (like, comment, link click, photo click etc).
CPC link: The average cost for each link click.
CTR link: #Link_Clicks divided by impressions
CTR All: The percentage of times people saw your ad and performed a click (all).
Amount Spent: The estimated total amount of money you’ve spent on your campaign, ad set or ad during its schedule.
CPM: The average cost for 1,000 impressions.
Estimated Ad Recall: How many people Facebook estimates will remember seeing your ad within a two-day window
Distributions Score Photo: Impressions + Reactions + Comments + Shares + Content Clicks
Distributions Score Video: Avg.Minutes Watched + 1 min. Views + Reactions,Comments,Shares
How News Feed Works: Gathers signals from all the available posts and users.
Then Facebook does its magic with Machine Learning. The output is the total value for each post.
Total Value = Advertiser Bid * Estimated Action Rate + Ad Quality
Do you want more details? Check my previous post on how Facebook Algorithm works.
Profile Visits: The number of times your profile was visited.
Save Post: It is what it is! Just saving a post so you can see it again later.
Content Interactions: It shows the actions that people take when they engage with your content (Likes, Comments, Saves, Shares).
Profile Impressions: The number of times your posts and stories have been seen.
Profile Reach: Reach refers to the number of different people who see your post. One person can see your post 5 times but is only counted once toward Reach.
Profile Views: The number of times your Instagram profile page was viewed over the selected time period.
Product Views: The total number of times people tapped on the product tag to view the product page.
Product Button Clicks: The total number of times people visited a product page from this post and then tapped the button on the product page.
Basic Metrics: Followers Count, Profile Views, Video Views
Engagement Metrics: Save, Like, Comment, Share
Follower Activity:
Traffic Sources: Where your viewers come from.
Video Views breakdown by:
Trending videos: Top 9 videos with the fastest growth in viewership over the past seven days.
Post lifespan: Your post likes, comments, shares, views (depending on the filter applied) during the first 24 hours compared to the previous post.
Post density: Your posting habits per day or per hour. Data updated ~every hour.
Other metrics to check:
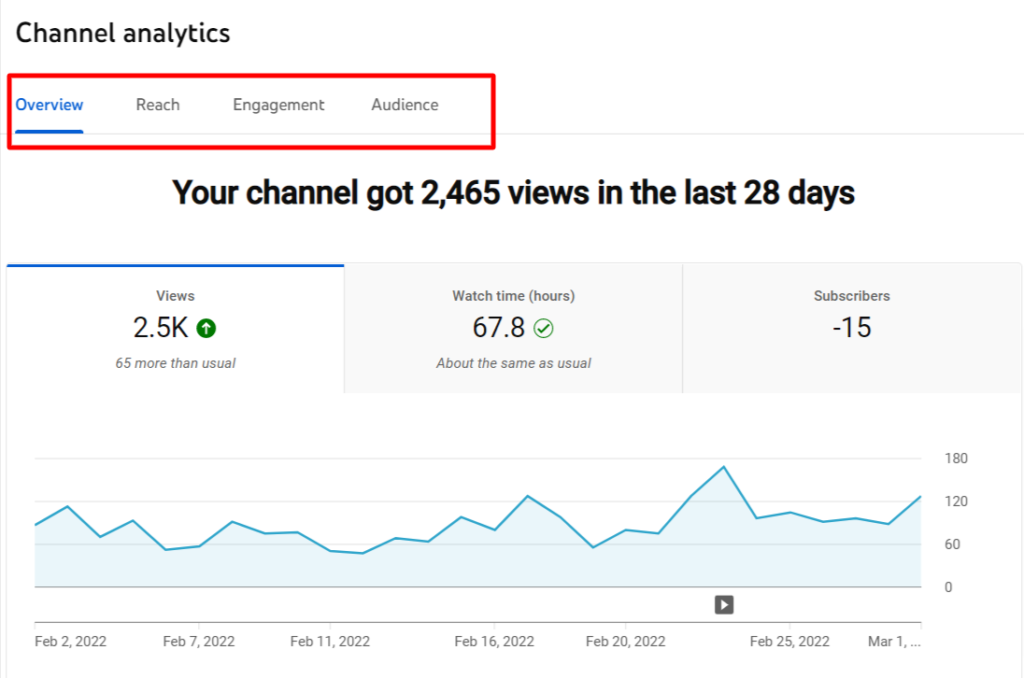
Overview
Typical performance: A comparison to your latest video to your channel’s typical performance.
Top videos: Your recent videos ranked by views.
Realtime: Your performance over the last 48 hours or 60 minutes.
Latest videos: Your performance from your 10 latest videos.
Stories: Your performance over the last 7 days from your latest Stories.
YouTube Reach
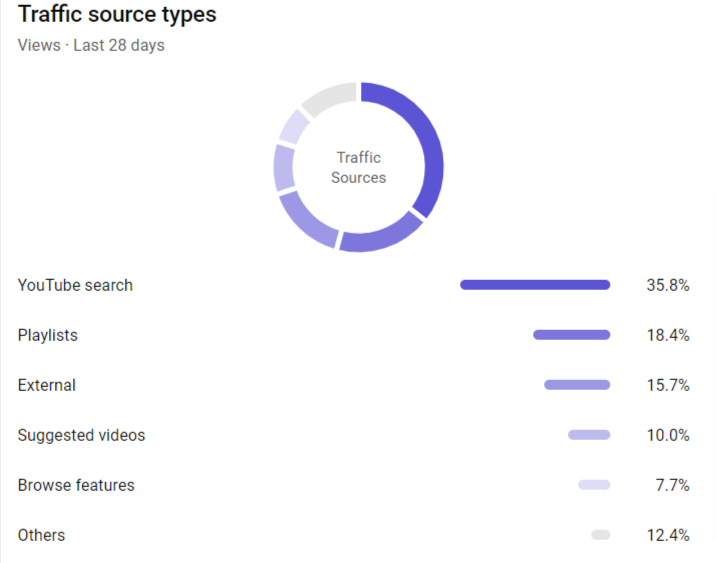
Traffic source types: How viewers found your content.
External: Traffic from websites and apps that embed or link to videos from your channel.
Suggested videos: Traffic from suggestions that appear next to or after other videos and from links in video descriptions.These videos could be your own videos or someone else’s.
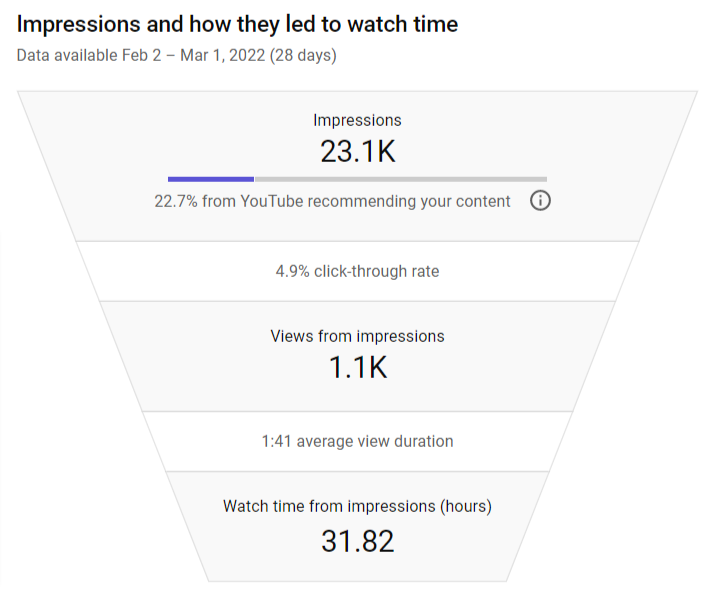
Impressions and how they led to watch time: How many times your video’s thumbnails were shown to viewers on YouTube (Impressions), how frequently those thumbnails resulted in a view (Click-through rate), and how those views ultimately led to watch time.
Playlists: Traffic from the most-watched playlists that include your videos.
YouTube search: Traffic from search terms that brought viewers to your content.
Top videos: Videos with the most watch time over the last 28 days.
Top playlists: Playlists with the most watch time over the last 28 days.
Top videos by end screen: Your channel’s most effective end screens over the last 28 days.
Top end screen element types: Your channel’s most effective end screen element types over the last 28 days.
Top posts: Your top Community posts over the last 28 days.
Videos growing your audience: Your audience’s online activity across your channel. Data is based on your new viewers across all devices in the last 90 days.
When your viewers are on YouTube: Your audience’s online activity across your channel and all of YouTube. Data is based on your viewers across all devices in the last 28 days.
Subscriber bell notifications: How many of your subscribers get all notifications from your channel. The tab also shows and how many can actually get those notifications, based on their YouTube and device settings.
Watch time from subscribers: Your audience’s watch time divided between non-subscribers and subscribers.
Age and gender: Your audience by age and gender. Data is based on signed in viewers across all devices.
Other channels your audience watches: Your audience’s online activity across other channels on YouTube. Data is based on your viewers across all devices in the last 28 days.
Other videos your audience watched: Your audience’s online activity outside of your channel. Data is based on your viewers across all devices in the last 7 days.
Top geographies: Your audience by geography. Data is based on IP address.
Top subtitle/CC languages: Your audience by subtitled language. Data is based on use of subtitles/CC.
Monthly estimated revenue: How much your channel has earned in the last 6 months. For ongoing months and months without finalized payments, revenue is estimated and subject to change.
Revenue sources: How you’re making money with YouTube.
Transaction revenue: Estimated net revenue from transactions, such as paid content and Super Chat. The estimate includes deducted partner charged refunds for the selected date range and area.
Top-earning videos: Videos with the highest estimated revenue for the time period.
Ad types: The format of the ad and its buying platform. This breakdown is only available for YouTube ad revenue and impression-based metrics.

Monthly Total Audience: The total number of people who have seen or engaged with your Pins in a 30 day window up to and including each day.
Monthly Total Engaged Audience: #People who have engaged with your Pins in a 30 day window.
Total Audience: Total number of people who have seen or engaged with your Pins.
Total Engaged Audience: People who have engaged with your Pins.
Pin Clicks: #number of clicks on your Pin or ad
Impressions: The number of times your Pins or ads were on screen.
Engagements: Number of Saves, Pin Clicks, Carousel card swipes, secondary creative collections and Idea Pin swipes.
Saves: The number of times people saved your video Pin to a board.
Pin Click Rate: The total number of clicks on your Pin or ad to content on or off Pinterest divided by the total number of times your Pins or ads were on screen.
Engagement Rate: Total engagement with your Pins / Impressions
Outbound Click: The number of times people perform actions that lead them to a destination off Pinterest
Outbound Click Rate: #number clicks / total number of times your Pins were on screen
Video Views: Amount of views for at least 2sec.
Average Play Time: The average time someone spent playing your video.
Total Play Time: The total play time for your video in minutes.